Students will need to know how to read, write (copying words they see around the classroom, talked about previously where they can find them), and log on to iPads. The students will need to be familiar with how to use an iPad.
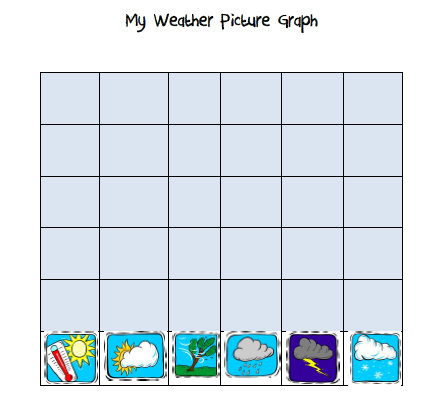
The students will be asked to check the weather on the weather application. While they pull up the weather on the weather application, I will pull up the weather on my computer and display it on the projector screen. Once we have all looked up the weather, we will decide what the weather each day is and have a bar chart in our classroom where we will keep track of the weather patterns, similar to the one below:
Earlier in the year, I will have gone over how to create a bar chart and graph data on a bar chart with the students and will review it to refresh their memory. They will know how to use an iPad from several previous lessons that I have taught during the school year.
No comments:
Post a Comment